Friday, 27 July 2018

Code like a pro: 31 tools for Android app developers

What are the best tools to improve your development productivity and build better Android apps? I've been using these tools for a while, and they have helped me and my team save a lot of precious time and deliver higher-quality apps.
Here are the tools that have earned a place in my developer's toolbox. Start here and you'll be well on your way to developing Android apps like a pro.
Gartner Magic Quadrant for Software Test Automation

FlowUp

This amazing tool helps you track the overall performance of your production apps, with in-depth insights on key performance metrics such as FPS, memory usage, CPU usage, disk usage, and more. FlowUp is priced based on number of users.
Flow Up

Stetho

A powerful open-source debugging platform for Android that developed by Facebook, Stetho makes debugging native Android apps as simple as debugging web pages using Chrome’s DevTools. It allows you to check the complete View hierarchy, inspect your SQLite database, monitor network operations, and perform other actions with ease.
Stetho

JRebel for Android

We all get quite frustrated staring at the screen like a fool and waiting for Gradle builds that take forever to finish. But this awesome tool from JRebel comes to the rescue by drastically improving build times and making Android app development and debugging almost real time. JRebel pricing depends on the number of developer seats and the duration of the license.
JRebel for Android

Gradle, Please

If you are using Gradle as your build system in Android Studio, then you can add any external library in your project with just a single line of code. But how do you get that line quickly and easily? That's where this sweet little website comes in handy. Visit the site and you'll be able to quickly find the line of code for the library you want to use.
Gradle Please

Android Asset Studio

An awesome (free) collection of easy-to-use tools that generate various types of icons (launcher, notification, generic, app shortcut icons) that you will need while designing and developing Android apps.
Android Asset Studio

LeakCanary

LeakCanary is a powerful open-source tool, developed by Square, that makes the difficult and time-consuming job of detecting memory leaks much easier. Once set up, it will automatically start giving you notifications whenever memory leaks happen in your app, with a complete stack trace to help you fix the problem.
LeakCanary

DryRun

DryRun is a really useful and innovative tool that can let you test-run any Android library hosted online in just a few seconds. This open-source tool makes it incredibly easy for my team to try out various libraries that we discover daily, with almost no effort.
DryRun

Slides Code Highlighter

As developers and team leads, we have to give presentations and tech talks quite often, or just show a fancy code snippet to another developer. This is where a nifty (free) tool by Roman Nurikcomes in handy by turning your boring chunks of code into a beautifully highlighted and presentable code snippet.
Slides Code Highlighter

InstaBug

I have been using this tool for a while and find that it has significantly changed the way my users provide app feedback to me. They can now share screenshots, video and audio recordings, detailed logs, and so much more to help me identify and fix bugs easily. Pricing depends on number of team members, apps, and months of data retention.
InstaBug

Takt

Takt is a tiny open-source library that you can use to check the FPS of every corner of your app while debugging it. It is always better to catch bugs and significant lags in the development phase so that you're not letting your users have the potential for a bad experience while using the production app.
Takt

Android Debug Database

Android Debug Database is an awesome open-source tool that completely changes the way you debug the databases and shared preferences in your Android application. You can now view, edit, and delete all the data as well as run SQL queries in a clean and beautiful user interface.
Android Debug Database

Source Tree

Source Tree is a clean, simple open-source tool to make Git more user-friendly. You can visualize all your changes, commits, and branches in a beautiful way and never have to write a single command in the command line again. It can also be highly useful for all the beginners out there who tend to get confused with the vastness of Git.
Source Tree

GenyMotion

Back in the days when the Android emulator was slower than a snail, GenyMotion was the only emulator of choice for Android developers. Since then, GenyMotion has expanded from being just an emulator to becoming a complete platform for advanced app development, testing, and deployment. Pricing is based on developers per year.
GenyMotion

Vysor

If you don’t like to develop apps on an emulator but want the ease of doing so, you should check out Vysor, which allows you to mirror your real device to your computer. Moreover, you can use this tool to easily show live app demos on big TV screens and projectors to your team members. Vysor has pro features that are cheap to buy for a single device.
Vysor

Android WiFi ADB

With this open-source tool, you can now run your Android app from Android Studio on your device using Wi-Fi. You don’t need to keep your device attached to your computer through a cable and can enjoy the experience of developing and testing apps wirelessly.
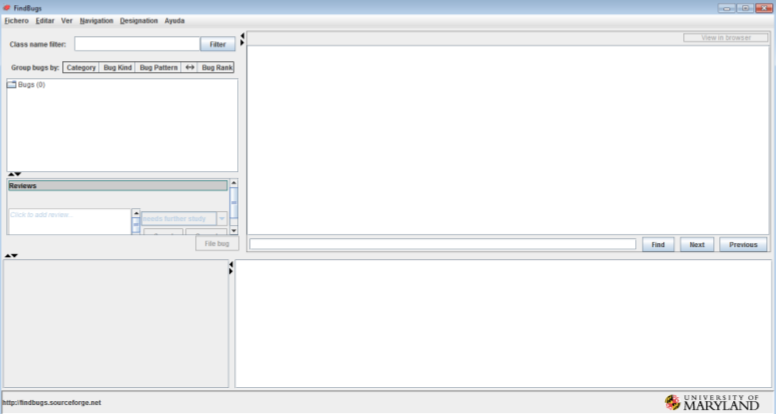
Android WiFi ADB

FindBugs

This free plugin for Android Studio can be quite useful for detecting common Java bugs early in development. While building large applications, we tend to unknowingly introduce several small bugs here and there that get caught later in production, causing mayhem.
FindBugs

Drawable Optimizer

Using several image assets in an Android app tends to contribute a lot toward the size of the APK. But this nifty Gradle plugin can optimize these images and reduce the resultant APK size significantly for you.
Drawable Optimizer

Scalpel

This innovative open-source tool, created by Jake Wharton, lets you experience a 3D visual representation of the entire layout of your app. Beginners will find it really fascinating, since it can give them a completely new perspective when looking into their layouts.
Scalpel

BlockCanary

Another powerful performance-monitoring library, BlockCanary is an open-source tool that can help you detect instances of your app’s UI thread getting blocked long enough to make it lag. It's very easy to set up and it works very similarly to LeakCanary.
BlockCanary

NimbleDroid

NimbleDroid is another awesome tool to test your app for memory leaks and critical issues before publishing it on Play Store. It works quite well and automatically tests various user flows of your app to find potential crashes and critical issues that need immediate attention. Pricing is customized after requesting a demo.
NimbleDroid

Methods Count

Who doesn’t love adding awesome libraries to their project to increase its functionality? But you always have to think about the dreaded problem of the 65K method limit. This free tool comes in handy when you need to check the number of methods each library adds to your app.
Methods Count

Android Tool for Mac

If you are an Android developer and using a Mac, then this tiny open-source tool can help you get bug reports, screenshots, and video recordings of the app that you are debugging with a single click.
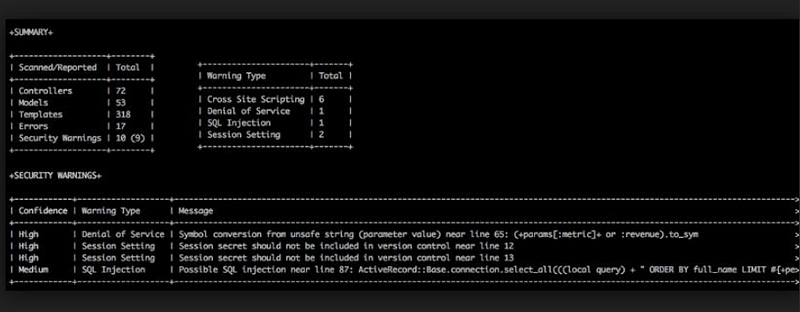
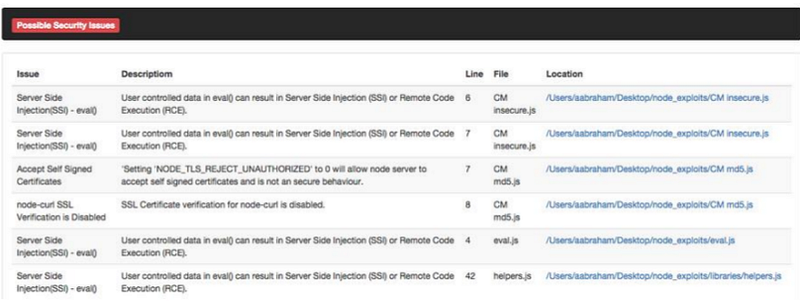
Android Tool for Mac

DevKnox

There are several security flaws hidden inside our apps that developers are sometimes not even aware of, and it can take quite a lot of experience and effort before you understand various critical aspects of security enough to catch these flaws. But this awesome tool can help you detect security flaws, and it has a functionality that's just as easy to use as a spell checker in your IDE. 
DevKnox

JSONSchema2POJO

It can be tricky when you have a JSON and want to make an equivalent POJO from it. It can be boring and time-consuming, but there's a tool that makes the process much easier. All you need to do is paste your JSON into the JSONSchema2POJO site, and it will generate all POJO classes automatically for you.
JSONSchema2POJO

ADB IDEA

This awesome open-source plugin for Android Studio can get a lot of things done and help you speed up your day-to-day Android development considerably. You can easily, start, restart, kill, clear data, and uninstall your apps right from the IDE—saving a lot of time.
ADB IDEA

Key Promoter

We all know how helpful and quick keyboard shortcuts are, but there are so many shortcuts for so many different actions that it is difficult to remember them all. This is where the Key Promoter plugin comes into play, making keyboard shortcuts easy to reference.
Key Promoter

Fabric

You might already know how powerful and awesome Fabric is. It's a pretty popular modular SDK that allows users to pick and choose from a suite of tools. It was recently acquired by Google and is free to use. The tool suite includes beta-testing deployment, crash analytics, user analytics, and advertising tools. Give it a try if you haven’t already.
Fabric for Android

ClassyShark

With ClassyShark, you can inspect any Android APK to find a lot of valuable information about it, such as the classes, resources, manifest, dependencies, dex count, and much more. It can give you an idea of what other apps are doing and probably how they are doing it. ClassyShark is open source.
ClassyShark

APK DeGuard

This is one of the best and probably the most accurate de-obfuscators for Android apps. It uses machine learning to analyze various apps and make sure they deliver the best possible result every time. It helped me a lot when I was inspecting some apps and trying to understand how they implement certain features.
APK DeGuard

Codota

Quite often we get stuck while developing something new and need to check some quick code examples from StackOverflow or Github. This plugin lets you do just that without even leaving your IDE.
Codota

Material Design Icon Generator

This plugin for Android Studio lets you get access to all Material Design Icons and customize them right from your IDE, saving you a lot of time when developing apps.
Material Design Icon Generator

What are your top tools?

I am sure you found a lot of new and exciting tools on this list and will immediately start using some of them to boost your development productivity. You should also encourage your team members to start using some of these as well.
If you liked this compilation, please share it with your friends to help them develop better apps. And tell us about your top professional Android development tools in the comments.

Top 12 Free and Paid Code Quality Tools for Web Developers 2016

Programming has become one of the biggest and most innovating industries on the planet. Web development, software development, software engineering, database administration, hardware engineering, even simple freelancing can bring about work related to programming and the use of code. Programming for the most part is appealing because it promises creative expression, but also high-end jobs that can help skilled programmers earn up to $200,000+ a year, without having to do much more than write and optimize code.
The leading Worlds technology companies; Google, Microsoft, etc,. have been known to provide its workers with incredible life-long benefits in exchange for their loyalty and service to the company. Money is oftentimes a factor for freelancers and individuals to start their self-taught programming journey, since there is no shortage of learning materials available; for any kind of programming language imaginable. Though there is one simple catch with the idea of teaching yourself how to program.
Code quality has always been an issue within the programmers communities, good code is the kind of code that can be reused years after it has been written, where as low quality programmers will oftentimes write code that is meant to solve a problem that exists at the time of writing the code, rather than thinking ahead of time as to how to scale the code base as it grows, and how to write code that other programmers would be easily able to follow along in case of someone else having to take over a specific project. To battle this, programmers need to introduce themselves to programming language style guides, but also to code quality testing tools that enable to check code against common issues and misuses.

SonarQube

SonarQube
SonarQube offers continuous code testing features that will ensure your code files, code projects, modules and folders are always tested for quality and will allow you to stay on top of the game when it comes to good quality code. The main areas of focus of the SonarQube platform are comments, coding rules, potential bugs, complexity, unit tests, duplications, and architecture & design. Whether you’re a small business company, a freelancer or a fully scaled enterprise corporation, SonarQube has something to offer to all levels of coding enthusiasts; projects.

Closure Linter

Closure Linter     Google Developers
The Closure Linter is a utility that checks JavaScript files for style issues such as operator placement, missing semicolons, spacing, the presence of JsDoc annotations, and more. The thing to remember about Closure Linter is that it follows Google’s official style guide for JavaSript, and the Linter itself is built in such a way that it can automatically detect and fix common code problems without your direct interaction, helping you to remain more productive as your project continues to grow. Works fine on Mac, Linux and Windows computers.

ESLint

ESLint Pluggable JavaScript linter
ESLint is a tool for identifying and reporting on patterns found in ECMAScript/JavaScript code, with the goal of making code more consistent and avoiding bugs. You will need to have Node.js pre-installed in order to use ESLint. This particular linter is being used by companies like Facebook, Box, PayPal, Zendesk and many more. Linting is all about analysing the code without having to execute it, and ESLint — as a tool — is somewhat of an expert in this area. Write your code, sit back and relax as it is being thoroughly optimized without the need to manipulate it.

JSHint

JSHint a JavaScript Code Quality Tool
JSHint is another famous static code analysis tool that can be used directly from the browser. JSHint output gives you all the technical information about your code and its metrics, and reports back any errors like missing variables and definitions whilst highlighting them in your code. Developers and engineers from companies like Wikipedia, Mozilla, RedHat and jQuery are all using JSHint to ensure the highest code quality.

Klocwork

Source Code Analysis Tools for Security Reliability Klocwork
Klocwork has been built to become a part of your development environment, rather than just an external tool that can be used for static code analysis. Klocwork will natively integrate with IDE’s like Microsofts Visual Studio, Eclipse, and IntelliJ IDEA — giving you all the features and options of the actual Klocwork platform within your IDE. These features include automatic security scan of your code, static code analysis in real-time, refactoring of code to ensure its structure, a metrics and reporting feature to analyze team performance, visual code architecture to better understand the end result of your projects, as well as an option to have your code reviewed for additional insight and further understanding.

Sidekick

Sidekick Be a code superhero
Sidekick is a code analysis tool that’s currently in beta stages, supporting Ruby, CoffeeScript and JavaScript code for analysis. Get your code analysed for the perfect style guides, push code updates and have only the new pieces of code analyzed, watch as your productivity and code quality increases as Sidekick continues to give you back the most comprehensive insights with perfect acuity.

JSLint

JSLint  The JavaScript Code Quality Tool
JSLint was built to help programmers express themselves in a creative way without having to lose the quality of code due to following bad style guidelines, or otherwise tampering the code with bad quality syntax. Use the feature settings panel at the bottom of the page to assume different coding environments, and to select the kind of possible style errors to tolerate in order to maximize the effectiveness of your code optimization. Strictly for JavaScript developers only.

Coverity

Software Testing and Static Analysis Tools Coverity
Coverity is a recognized name across the largest brands on the planet; Samsung, Sega and many other well-known names use Coverity to analyze and optimize code and software quality. The Coverity’s code quite suite offers a range of tools that allow to scan software source code for errors that could potentially cause permanent harm to the company, it will scan for strange behavior, potential security risks, or all-in-all risks that could cause software to fail. This is a private company that has more than two hundred employees in three different continents.

jsLint

jsLint.it Online JavaScript Code Quality Tool
Yes, there are two code quality tools on this list with the same exact name, though both offer a range of different features. This particular JSLint takes your JavaScript source code and scans it for potential errors and if a problem has been found, it will automatically output a concise error message explaining what the cause of the error is, and where it is located within the source code. Whilst most of JavaScript errors are related to syntax, there are cases when style and structure comes into play as well, as this JSLint has been built to recognize those problems and help you solve them.

Code Climate

Code Climate. Hosted static analysis for Ruby PHP and JavaScript source code.
Code Climate is a self-hosted code quality platform — with an option to use it within the cloud for a monthly price — that helps you to test your code for test coverage, complexity, duplication, security, style, and more. It works out of the box with GitHub. Every time you push a new commit, Code Climate will fetch that commit, analyze it and then report back to you with potential fixes on your errors. It’s the perfect compliment towards a good and productive development environment; for individuals and teams.

Pylint

Pylint code analysis for Python www.pylint.org
Python developers need to lint their code as well, which is why Pylint has been established. Pylint helps you to analyze your Python scripts directly from within the command shell. Just load up Pylint and specify the file that you want to check and Pylint will output all the essential information about your code.

Codacy

Codacy Automated Code Review
The last code quality tool on our list is Codacy — a free to use code quality checking tool that automatically checks your code for common errors and problems, and reports it back in a styling dashboard like environment.

Mar 5 Top Free Static Code Analysis Tools

How many times, did you need an automatic static code analyzer? What was your first option? Some people often think in some commercial solutions like Fortify or Veracode, but what about the free options? The commercial options are too expensive, for small companies or for freelance security specialists. For that reason, we are going to enumerate the top of free static code analysis tools.

Brakeman

For: Ruby
Setup: Require Ruby and Gem. Install using “gem install Brakeman”.
How to use: “brakeman application_path”
Link: https://github.com/presidentbeef/brakeman
Comments: It the best scanner for Ruby. Its specialty is the “on rails” applications.
Brakeman — Ruby

NodeJsScan

For: NodeJs
Setup: It only requires python.
How to use: “python NodeJsScan.py -d <dir>”
Link: https://github.com/ajinabraham/NodeJsScan
Comments: This scanner has a minimum of false positive. It has periodic updates.
NodeJs Scan — NodeJs

RIPS

For: PHP
Setup: It requires PHP.
How to use: RIPS is a web application written in PHP, you have to install Apache HTTP and run the web application.
Link: https://sourceforge.net/projects/rips-scanner
Comments: This is great scanner. It finds a lot of possible issues. Sadly, the new version is not free, so the free version is not supported any more.
RIPS — PHP

Findbugs

For: Java
Setup: It requires Java SE.
How to use: Open the jar application, and select the source code folder.
Link: http://findbugs.sourceforge.net/
Comments: Findbugs is a general purpose scanner. It will find for bugs and bad practices. In particular, it has got a security module, which can find security issues like XSS, SQLi, etc.
Findbugs — Java

Microsoft FxCop

For: .Net
Setup: It requires .Net
How to use: Open the application, and select the exe or dll files.
Link: https://msdn.microsoft.com/en-us/library/bb429476(v=vs.80).aspx
Comments: This is a good scanner, it will find the most of the vulnerabilities. This scanner will analyze the compiled files. If you have the code, you need compiled it.
Microsoft FxCop — .Net

JsHint

For: JavaScript
Setup: It requires NodeJs. To install run “npm install -g jshint”.
How to use: “jshint application_path”
Link: http://jshint.com
Comments: It find a lot of false positives. It finds code bad practices, most of them are not false positives (LOL).
JsHint — JavaScript

CodeCrawler

For: C#
Setup: It requires .Net
How to use: Open the application folder with the source code.
Link: https://codecrawler.codeplex.com/
Comments: It finds a lot of false positives and fails several times (crash!).
CodeCrawler — C#

YASCA

For: .Net, Java, C/C++, HTML, JavaScript, ASP, ColdFusion, PHP, COBOL
Setup: Install the msi.
How to use: “yasca.exe application_path”
Link: http://www.scovetta.com/yasca.html
Comments: It is a multi-language scanner. It finds a lot of false positives. It finds some bad practices too.
Yasca — .Net, Java, C/C++, HTML, JavaScript, ASP, ColdFusion, PHP, COBOL

Visual Code Grepper

For: C++, C#, VB, PHP, Java and PL/SQL
Setup: Install the msi.
How to use: Open the application and select the source code.
Link: https://sourceforge.net/projects/visualcodegrepp/
Comments: It is a multi-language scanner too. It finds a lot of false positives, but less than YASCA.
Visual Code Grepper — C++, C#, VB, PHP, Java and PL/SQL

Graudit (Only Linux)

For: ASP, JSP, Perl, PHP, Python
Setup: Download and execute.
How to use: “graudit application_path”.
Link: https://github.com/wireghoul/graudit
Comments: This scanner uses a knowledge base based in regular expressions. The most advantage is that can be easily customize to find custom issues. Using the default base, I did not get good results, a lot of false positives web found, and many real issues were not identified.
Graudit — C++, C#, VB, PHP, Java and PL/SQL

Code Warrior (Only Linux)

For: C, C#, PHP, Java, Ruby, ASP, JavaScript
Setup: Download and compiled it using “make”.
How to use: Open the application and select the source code.
Link: https://github.com/CoolerVoid/codewarrior
Comments: Like RIPS this scanner is a web application. But we do not need Apache, only run the scanner, and the browser will be opened. Then we have to select the source code. In my opinion, and based in the results, this “multi” scanner is the best option. It find a lot of issues, and a low rate of false positives.
Code Warrior — C, C#, PHP, Java, Ruby, ASP, JavaScript

The best ways to connect to the server using Angular CLI

Everybody who has used  Angular CLI  knows that it is a powerful tool which can take a front-end development job to a completely dif...